Compute
Storage
For consumers
Workloads
Why Hivenet


Sign in to Hivenet
Access your files and manage your storage account.
Store
Access your files and manage your storage account.
Compute
Launch instances and manage your compute resources.
Store and Compute still use separate accounts today. We’re working on a unified sign-in.
Just need to send a file?
Use Send directlyNew to Hivenet? Get Started
Get started with Hivenet
Choose what you want to use first.
Store
Back up photos and files across your devices.
Compute
Launch self-serve GPU compute for demanding work.
Store and Compute still use separate accounts today. We’re working on a unified account experience.
Need Hivenet for business?
Talk to salesNeed to send a file?
Open SendAlready have an account? Sign in
GPU pricing chart: complete guide to understanding real GPU costs in 2026
A GPU pricing chart should tell you exactly what you’ll pay for graphics card compute—but most charts available today mix incompatible pricing models, making direct comparison impossible. When one chart shows an RTX 4090 at $0.15/hr and another at €0.20/hr, the difference isn’t just cost—it’s whether your job will survive to completion, whether you’re getting the full card, and whether the final bill matches the advertised rate.
This guide covers how to read and compare GPU pricing charts accurately, with focus on separating on-demand from spot pricing, dedicated from shared access, and transparent billing from layered fee structures. The target audience includes AI developers, researchers, content creators, and organizations who need reliable GPU compute access and want to understand what they’re actually buying when they check prices across providers.
Direct answer: Most GPU pricing charts conflate incompatible service tiers. A meaningful comparison requires separating dedicated on-demand rates from spot/shared instances—the cheapest number attached to a GPU model often represents capacity you can’t reliably use for production work.
By the end of this guide, you will:
- Understand how pricing classification systems affect real GPU costs
- Identify hidden costs that can double or triple headline rates
- Compare GPU prices across providers using consistent quality criteria
- Make informed decisions about GPU procurement for your specific workloads
- Recognize which “gpu deals” represent genuine value versus misleading advertising
Understanding gpu pricing fundamentals
Standard GPU pricing charts often mislead buyers because they present a single number—the hourly rate—without revealing the conditions attached to that price. The current state of the gpu market in early 2025 shows dramatic price volatility, with some models like the RTX 5060 experiencing 31% price increases in a single month. The generation (gen) of a GPU is a key factor in both pricing and performance, as current gen models from NVIDIA, AMD, and Intel often command higher prices and offer better value for new buyers. This volatility makes understanding pricing fundamentals essential before comparing any charts. Your PC's graphics card is the heart of a gaming PC and has the biggest impact on pure gaming performance. Additionally, the GPU market has seen an increase in stock levels, with the number of total in-stock listings rising from 135 to 171 models since June, and in-stock listings for MSRP increasing from 13 to 58, reflecting significantly improved availability.
Headline pricing vs real-world costs
Headline pricing refers to the advertised GPU hourly rate that appears in most pricing charts—the number providers want you to see first. Real-world costs include everything else: storage fees for your data, bandwidth charges for moving data in and out, egress costs, and platform overhead fees that appear only on your final invoice.
The difference matters significantly. When hyperscalers advertise a “GPU hourly rate,” they frequently exclude storage costs (which can add €0.10–0.50/hr for temporary workspace), bandwidth charges (€0.12–1.00 per GB for egress), and various platform fees. Research indicates that when these costs are included, the effective GPU hourly cost can reach 2–3x the advertised rate. A chart showing €0.50/hr that becomes €1.50/hr in practice provides fundamentally misleading data for budgeting.
Access quality classifications
Dedicated GPU access means you receive the full graphics card—all compute power, all VRAM, all memory bandwidth—exclusively for your workload. Shared or virtualized GPU access means your allocation competes with other tenants, and your job may slow dramatically when others spike their usage.
Guaranteed access (on-demand) ensures your instance persists until you terminate it. Interruptible access (spot or preemptible) offers lower rates but can terminate your job mid-computation when demand increases—potentially losing hours of training progress on a large model. For workloads requiring 48+ hours of continuous computation, this difference determines whether your job completes at all.
The relationship to pricing is direct: higher quality access commands premium rates, but delivers predictable results and costs. A “good deal” on paper becomes expensive if your 47-hour training job terminates at hour 46 and must restart.
Billing transparency levels
Transparent pricing means fixed, published rates you can book immediately—the price on the chart is the price you pay. Dynamic or bidding models mean the hourly rate fluctuates based on demand at the moment you launch your job, making accurate budgeting impossible.
Some gpu deals that appear in charts use bidding mechanisms where the “lowest price” shown was available briefly at low-demand periods but won’t match what you’ll pay during normal business hours. The distinction between fixed-rate providers and variable-rate marketplaces is essential for any organization that needs predictable costs.
This foundation in pricing fundamentals prepares you to evaluate the specific GPU pricing models available in today’s market.
Types of gpu pricing models
Building on these fundamentals, GPU pricing charts should organize offerings by model type rather than simply listing GPU names and numbers. When considering GPU upgrades and pricing, it's important to evaluate your overall system, including power supply requirements and compatibility. Always check your PC case clearance and airflow before upgrading your GPU. Additionally, modern GPUs support HDMI 2.1 and DisplayPort 2.1, enabling higher refresh rates and multi-monitor setups. The pricing model determines whether the rate represents reliable capacity or speculative availability.
On-demand vs spot pricing
On-demand pricing provides fixed rates with guaranteed availability—you request an RTX 5090, you receive an RTX 5090, and your job runs until you stop it. The hourly cost is predictable: €0.40/hr means €288/month for continuous usage, enabling accurate project budgeting.
Spot or preemptible pricing offers lower hourly rates—sometimes 50–70% below on-demand—but your instance can be terminated with minimal warning when demand spikes. For batch processing jobs that checkpoint frequently and can resume after interruption, spot pricing offers genuine savings. For long-running training jobs, real-time inference, or deadline-sensitive work, spot pricing creates unacceptable risk.
Use case guidance: Choose on-demand for production workloads, training runs over 4 hours, and any job where interruption costs exceed the hourly savings. Choose spot only for fault-tolerant batch processing with robust checkpointing, or for development and testing where restarts are acceptable.
Dedicated vs shared gpu access
Dedicated GPU access provides the full graphics card specification—an RTX 4090 with 24GB VRAM means you access all 24GB. Performance remains consistent regardless of other users on the same physical hardware.
Shared or virtualized GPU access divides resources among multiple tenants. Your allocation might be “8GB of an RTX 4090” or “25% of compute capacity.” When neighbors run demanding workloads, your frame rates and throughput decrease. For machine learning inference or games requiring consistent performance, this variability undermines the purpose of renting powerful hardware.
Pricing differences reflect this quality gap. A chart showing “RTX 4090 at $0.15/hr” for shared access versus “RTX 4090 at €0.20/hr” for dedicated access isn’t comparing equivalent products. The dedicated option often delivers better value per unit of usable compute.
Hyperscaler vs distributed provider models
AWS, Google Cloud, and Azure (the hyperscalers) present GPU pricing that appears competitive until you account for the full stack. Storage costs in Western Europe can add €2.80–3.20/hr for certain GPU tiers. Egress fees accumulate when moving training data or model outputs. Platform fees and minimum commitments create cost structures that charts rarely capture completely.
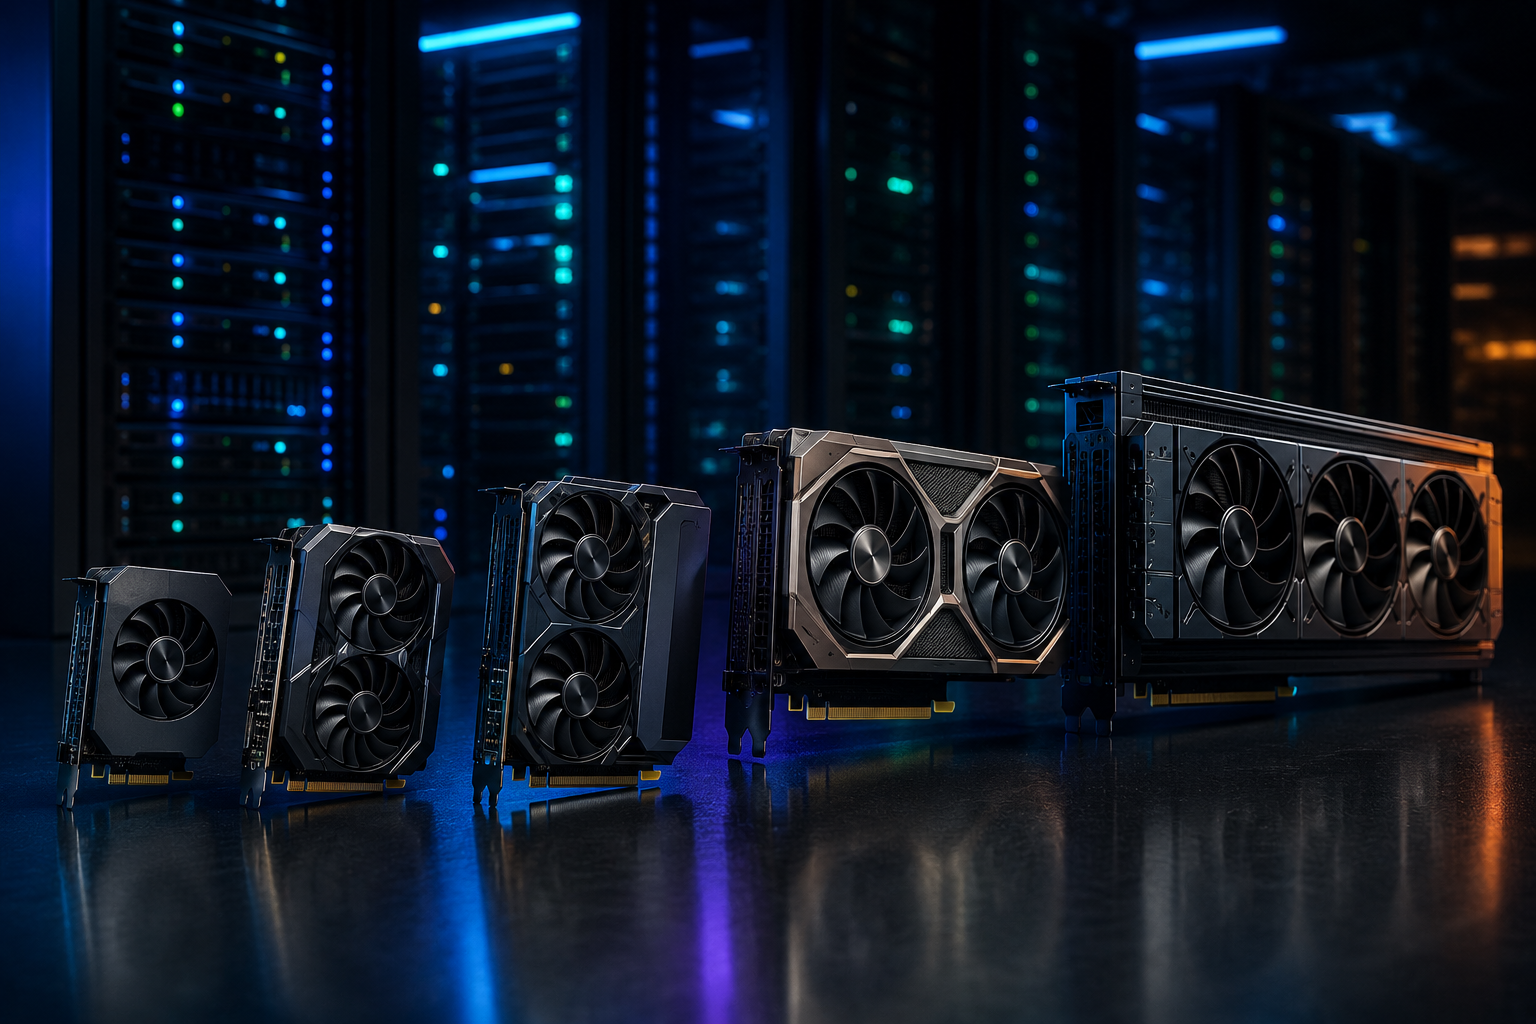
Distributed providers offer alternative models. Compute with Hivenet exemplifies transparent pricing: RTX 4090 at €0.40/hr and RTX 5090 at €0.75/hr, with on-demand availability, dedicated VRAM, fixed book-now rates, and transparent billing. There’s no bidding, no hidden egress fees, and human support available when jobs fail unexpectedly.
This transparency makes distributed providers particularly valuable as baselines in pricing charts—they establish what a “clean” price looks like, against which hyperscaler complexity can be measured.
How to read and compare gpu prices and pricing charts
With pricing models understood, you can systematically evaluate GPU pricing charts for accurate cost projection rather than accepting headline numbers at face value. When comparing options, remember to consider AMD's Radeon lineup, including models like the RX 9060 XT and RX 9070 XT, alongside Nvidia and Intel GPUs for a comprehensive view.
Pay special attention to models such as the RTX 5060 Ti and 5060 Ti, which come in different VRAM configurations and occupy unique positions in the current pricing landscape. Comparing these variants helps you understand how they stack up against other models like the 5070 and 5090 in terms of price, performance, and availability.
When assessing value, always look for the best bang for the buck—identify GPUs that offer strong performance relative to their price, especially if you're building a PC on a budget.
Keep in mind that most pricing data is focused on the US market, and prices in other regions may vary due to local taxes, tariffs, and stock availability.
Essential comparison criteria
Effective GPU provider evaluation requires checking multiple factors beyond the hourly rate. Before accepting any chart as authoritative for your decision:
- Classify the pricing model: Determine whether each entry represents on-demand, spot, shared, or dedicated access—charts mixing these categories compare incompatible products
- Calculate total cost: Add storage, bandwidth, and egress fees to the GPU hourly rate—request itemized pricing if providers don’t publish complete cost structures
- Verify GPU specification accuracy: Confirm VRAM amounts, compute capability, and generation (an RTX 4090 and RTX 3090 are not interchangeable despite similar naming)
- Assess provider reliability and support: Check uptime guarantees, support responsiveness, and business continuity—the cheapest provider becomes expensive when your job fails and no one responds
Real-world cost and price history analysis framework
This comparison table illustrates how identical GPU models carry dramatically different real costs depending on provider type:
Provider Type
RTX 4090 Hourly Rate
Hidden Fees
Real Cost per Hour
Compute with Hivenet
€0.20
None
€0.20
Hyperscaler (typical)
$0.50
Storage + Egress
$0.75+
Budget Marketplace
$0.15
Interruptions + Oversubscription
Variable
The budget marketplace shows the lowest headline rate, but “variable” real cost reflects that your job may be interrupted, forcing restarts and wasted compute. The hyperscaler shows a reasonable price that expands significantly when storage and egress enter the calculation. Hivenet’s rate remains stable because the billing model includes what’s needed for actual work.
For the RTX 5090, similar dynamics apply. The €0.75/hr rate from transparent providers compares favorably against hyperscaler offerings that reach €0.60–0.80/hr when complete cost accounting is performed.
This framework helps you interpret charts that present only headline rates—the true value proposition lies in the real cost column, not the advertised number.
Common pricing chart pitfalls and solutions
Frequent misunderstandings in GPU cost evaluation lead to procurement decisions that seem rational based on charts but prove costly in practice. Before making a purchase, evaluate whether it makes sense to upgrade now or wait for future models, considering your current performance needs and the prevailing market conditions.
When buying GPUs, always check if the model is still on sale from original retailers. For discontinued models, be cautious with third-party sellers to avoid inflated prices. It is acceptable to purchase second-hand or ex-mining GPUs if the price is right, but be aware of the potential risks involved with such hardware.
Mixing incompatible pricing models
Many charts display nvidia cards, amd cards, and intel options in single tables without noting access quality differences. An RX 9070 XT at $699 (purchase) appears alongside an RTX 5070 Ti at $549/month (rental) alongside an RTX 4090 at $0.15/hr (spot)—three completely incompatible metrics.
Solution: Separate charts by access type. Compare dedicated on-demand rates only against other dedicated on-demand rates. Compare spot pricing only against other interruptible capacity. Compare purchase prices only against other retail options. Cross-category comparison produces misleading conclusions.
Ignoring total cost of ownership
Charts showing only GPU hourly rates ignore the cost of storing training data, transferring model checkpoints, and moving results to production systems. For large model training with gigabytes of data movement, these costs materially affect project economics.
Solution: Calculate storage, bandwidth, and support costs alongside GPU hourly rates. Request complete pricing documentation from providers before committing. If a provider cannot or will not itemize their complete cost structure, treat their headline rate as a lower bound, not a final price.
Overlooking provider reliability
The cheapest GPU hourly rate provides no value if the provider has poor availability, limited stock, or no support when jobs fail. A training job that crashes at 3 a.m. with no support contact costs more than the lost compute—it costs project momentum and deadline viability.
Solution: Factor uptime guarantees, support responsiveness, and business continuity into your evaluation. Providers offering human support, transparent SLAs, and accountability for failures deliver genuine value that pure cost comparison misses.
Assuming spot pricing viability for production
Spot pricing appears in charts as dramatically cheaper—sometimes 60–70% below on-demand rates. Teams assume these savings transfer to production workloads and budget accordingly.
Solution: Use dedicated providers like Compute with Hivenet for mission-critical workloads requiring guaranteed availability. Reserve spot pricing for development, testing, and truly fault-tolerant batch processing. Never build production timelines around interruptible capacity.
With these pitfalls addressed, you can approach GPU procurement with realistic cost expectations.
Next steps
A meaningful GPU pricing chart separates quality tiers and reveals true costs—not just the lowest number attached to a GPU name. The cheapest headline rate often represents capacity that’s interruptible, shared, or burdened with hidden fees that appear only on final invoices. Genuine cost comparison requires consistent quality classification: on-demand versus spot, dedicated versus shared, transparent versus layered billing.
Immediate action: Evaluate your current GPU providers using access quality and total cost criteria. Calculate what you actually pay per GPU hour including all fees, and compare against the service quality you receive.
Next step: Test dedicated providers with transparent pricing for your next GPU workload. Compute with Hivenet offers RTX 4090 at €0.40/hr and RTX 5090 at €0.75/hr with on-demand availability, dedicated VRAM, and human support—a baseline for what “clean” GPU pricing should look like.
Related exploration: GPU performance benchmarking helps you determine which models deliver the best value for your specific workloads. Workload optimization reduces the GPU hours required. Cloud cost management strategies help you monitor and control ongoing GPU expenses across multiple providers.
Additional resources
- GPU specification databases for comparing VRAM, tensor cores, ray tracing capability, and memory bandwidth across nvidia, amd, and intel models
- Cloud cost calculators that include storage, bandwidth, and egress alongside compute—essential for accurate budgeting
- Provider uptime monitoring tools that track availability and reliability metrics across major sales events and demand spikes
- Price history trackers that show how GPU costs have changed over time—a strong indicator of future pricing trends and the right moment to save on new gpu procurement
Frequently asked questions (FAQs) about GPU pricing and selection
What factors most influence GPU pricing in 2026?
GPU pricing is heavily influenced by VRAM and memory costs, supply chain dynamics, demand for AI-focused GPUs, and production shifts toward high-margin models. Memory prices can account for up to 80% of manufacturing costs, driving price increases across the board. Additionally, limited stock for popular models and shifts in production priorities affect availability and pricing.
How do I choose the right GPU for my gaming or content creation needs?
Consider your target resolution and refresh rate. For 1080p esports gaming, a midrange GPU suffices. For 1440p, prioritize stronger rasterization and ray tracing performance. For 4K gaming or content creation, opt for GPUs with 16GB or more VRAM, robust cooling, and an 850W+ power supply to handle higher power demands and maintain stable performance.
What is the difference between dedicated and shared GPU access?
Dedicated GPU access means you get the full GPU resources exclusively for your workload, ensuring consistent performance. Shared or virtualized access splits GPU resources among multiple users, which can cause performance variability. Pricing charts often mix these access types, so comparing them directly can be misleading.
Why do some GPUs cost more than their MSRP?
Prices above MSRP often result from high demand, limited supply, and increased manufacturing costs, particularly due to memory price hikes. Third-party sellers and board partners may also mark up prices. Certain flagship cards like the RTX 5090 currently sell significantly above MSRP due to lack of competition and scarce availability.
How do AI upscaling technologies affect GPU performance?
AI upscaling technologies such as NVIDIA’s DLSS, AMD’s FSR, and Intel’s XeSS boost frame rates by rendering at lower resolution and reconstructing higher-quality images. This allows GPUs to achieve higher frame rates at higher resolutions or settings without requiring proportionally more raw power.
What should I look for when buying a GPU from retailers or third party sellers?
Always verify the seller's legitimacy, especially with third party sellers, to avoid scams or overpriced listings. Check if the GPU is new or used, confirm warranty status, and compare prices across retailers like Newegg and Amazon. Be cautious of listings that switch automatically to third party sellers.
How does VRAM capacity impact gaming and AI workloads?
VRAM size affects how well a GPU can handle high-resolution textures, complex scenes, and AI workloads. For 1080p gaming, 8-12GB VRAM is usually sufficient. For 1440p, 12-16GB is recommended. For 4K gaming or intensive AI tasks, 16GB or more VRAM helps prevent stuttering and enables smoother performance.
Are newer GPU generations worth the upgrade?
Upgrading to newer generations like NVIDIA’s RTX 50-series or AMD’s RX 9000-series can provide benefits in ray tracing, AI features, and efficiency, especially at higher resolutions and refresh rates. However, if you primarily game at 1080p or 1440p without heavy ray tracing, gains may be incremental.
How can I track GPU prices effectively?
Use GPU price tracking tools and websites that monitor listings on popular retailers such as Newegg and Amazon. These tools provide real-time alerts when GPUs drop below MSRP or come back in stock, helping you buy at the best possible price.
What impact do memory price surges have on GPU availability?
Rising prices for GDDR6 and GDDR7 memory increase manufacturing costs, leading to higher GPU prices and limited supply. This especially affects high-end GPUs with large VRAM capacities. Manufacturers may prioritize memory allocation based on profitability, which can reduce availability for certain models.
How important is power supply when upgrading a GPU?
Power requirements vary by GPU model and board partner design. High-end GPUs often require 850W or more, especially when paired with high-core-count CPUs or overclocked systems. Always check the GPU’s recommended wattage and ensure your PSU has the necessary connectors and capacity.
What are “board partners” and how do they affect GPU pricing?
Board partners are manufacturers like ASUS, MSI, and Gigabyte who build and sell graphics cards using GPU chips from NVIDIA or AMD. Their custom cooling solutions, factory overclocks, and additional features can affect pricing, performance, and availability.
Can I use a GPU with a PCIe 5.0 motherboard?
Yes, GPUs are backward and forward compatible with PCIe slots. A PCIe 4.0 or 3.0 GPU will work in a PCIe 5.0 slot without issue, although bandwidth is limited to the lowest common version. This rarely impacts gaming performance significantly.
What settings should I adjust if my GPU is bottlenecked?
To reduce GPU bottlenecks, lower resolution and disable demanding graphics settings such as heavy ray tracing, ultra textures, motion blur, and depth of field. Enabling AI upscaling technologies can also improve frame rates while maintaining image quality.
How do I ensure my PC case supports a new GPU?
Check the physical dimensions and slot requirements of the GPU model and compare them to your PC case clearance and airflow. High-end GPUs can be long and thick, requiring 2.5 to 3.5 slots and robust cooling solutions.
What is the difference between AMD GPUs and NVIDIA GPUs in terms of features?
AMD GPUs often offer competitive raw rasterization performance and support for FSR upscaling, while NVIDIA GPUs generally lead in ray tracing performance and have mature AI features like DLSS. Choice depends on your preferred games, software compatibility, and specific feature requirements.
How do I calculate the best value GPU for my budget?
Evaluate the cost per frame by dividing the GPU price by its average frame rate in your target games or workloads. Sometimes paying a bit more for a higher-performing GPU yields better value through higher frame rates and longer life.
Your next workload belongs on Hivenet.
Pick one AI, compute, or storage workload and see the difference for yourself. Spin it up in minutes, or let our team map your fastest path to production.