
Sign in to Hivenet
Access your files and manage your storage account.
Store
Access your files and manage your storage account.
Compute
Launch instances and manage your compute resources.
Store and Compute still use separate accounts today. We’re working on a unified sign-in.
Just need to send a file?
Use Send directlyNew to Hivenet? Get Started
Get started with Hivenet
Choose what you want to use first.
Store
Back up photos and files across your devices.
Compute
Launch self-serve GPU compute for demanding work.
Store and Compute still use separate accounts today. We’re working on a unified account experience.
Need Hivenet for business?
Talk to salesNeed to send a file?
Open SendAlready have an account? Sign in
RTX 4090, RTX 5090, and A100 in one Llama 3.1 8B inference benchmark
This page reports one Llama 3.1 8B Instruct BF16 serving benchmark. The results apply to the recorded setup and load profiles, not to every model or AI workload.
We compared one RTX 4090, one RTX 5090, and one A100 80 GB using vLLM 0.8.3, ShareGPT prompts, an 8,192-token context, and a 512-token output. The test covered a moderate-load latency scenario and a high-load throughput scenario.
The measured single-GPU results are useful for this setup. They do not establish a general winner across other models, precisions, context lengths, training jobs, or multi-GPU systems.
The short version
- At 1 request/s, the RTX 5090 recorded lower latency than the A100 80 GB. Average time to first token was 45.41 ms on the RTX 5090 and 296.44 ms on the A100. Average end-to-end latency was 6,058.57 ms and 7,080.9 ms, respectively.
- At the high-load setting, the RTX 5090 and A100 recorded similar output-token throughput. The RTX 5090 measured 3,802.09 tokens/s and the A100 measured 3,748.16 tokens/s, a difference of about 1.4% in this run. Both recorded 7.58 sustained requests/s in the source result table.
- The RTX 4090 trailed both cards in this setup. It measured 737.65 tokens/s and 1.47 sustained requests/s in the high-load test.
- No two-GPU RTX 5090 result was measured. The earlier 7,604 tokens/s figure was a linear extrapolation from the single-GPU result and has been removed.
Without repeated runs and variance data, the small throughput difference between the RTX 5090 and A100 should be read as a result from this run, not proof of a consistent advantage.
Benchmark objective
- Compare latency and output-token throughput across the three recorded GPUs.
- Report the measured single-GPU results without extending them to untested models or multi-GPU configurations.
- Give readers enough setup information to judge whether the result is relevant to their own inference workload.
Hivenet's current benchmark methodology and reporting standard explains the fields expected in newer benchmark reports.
Static configuration
| Parameter | Value |
|---|---|
| Context length | 8,192 tokens |
| Output length | 512 tokens |
| Model | meta-llama/Meta-Llama-3.1-8B-Instruct |
| Precision | BF16 |
| Batch size | Automatic, based on GPU memory |
| Dataset | ShareGPT |
| Benchmark tool | vLLM 0.8.3 benchmark_serving.py |
Test scenarios
1. Moderate load: latency
| Attribute | Value |
|---|---|
| Request rate | 1 request/s |
| Number of prompts | 100 |
| Goal | Measure average TTFT and end-to-end latency |
2. High load: throughput
| Attribute | Value |
|---|---|
| Request rate | 1,100 requests/s |
| Number of prompts | 1,500 |
| Goal | Measure output-token throughput and sustained requests/s |
Results and analysis
Scenario 1: latency at 1 request/s
| GPU | Avg ITL (ms) | Avg TPOT (ms) | Avg TTFT (ms) | Avg E2E latency (ms) |
|---|---|---|---|---|
| RTX 4090 | 19 | 19 | 349.9 | 9,759.07 |
| RTX 5090 | 12.14 | 12.14 | 45.41 | 6,058.57 |
| A100 80 GB | 13.25 | 13.25 | 296.44 | 7,080.9 |
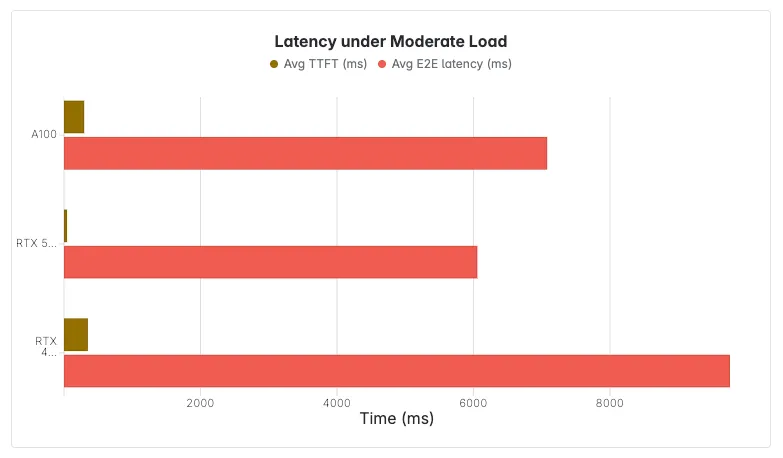
- The RTX 5090 recorded 45.41 ms average TTFT, compared with 296.44 ms for the A100 80 GB and 349.9 ms for the RTX 4090.
- Average end-to-end latency was 6,058.57 ms on the RTX 5090, 7,080.9 ms on the A100, and 9,759.07 ms on the RTX 4090.
- These values describe this model, prompt shape, software version, and load. They should not be generalized to other inference or training workloads.
Scenario 2: throughput at 1,100 requests/s
| GPU | Avg output-token throughput (tokens/s) | Sustained requests/s |
|---|---|---|
| RTX 4090 | 737.65 | 1.47 |
| RTX 5090 | 3,802.09 | 7.58 |
| A100 80 GB | 3,748.16 | 7.58 |
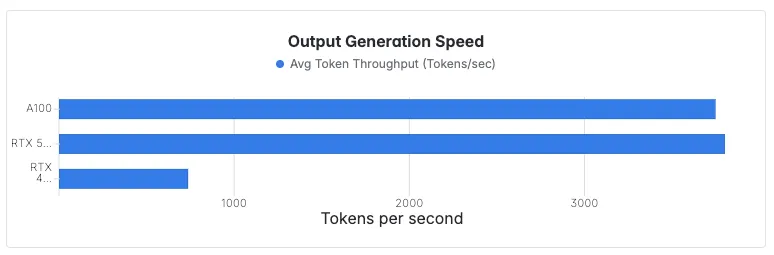
- The RTX 5090 recorded 3,802.09 output tokens/s and the A100 recorded 3,748.16 output tokens/s.
- The RTX 5090 and A100 both recorded 7.58 sustained requests/s in the source result table.
- The RTX 4090 recorded 737.65 output tokens/s and 1.47 sustained requests/s.
Limitations
This is a historical benchmark, and the surviving record does not contain every field required by Hivenet's current methodology. The exact A100 form factor, host CPU and system RAM, NVIDIA driver and CUDA versions, complete command and flags, test date, run count, variance, and error or saturation behavior were not recorded in the article or source PDF. We have not filled those gaps with assumptions.
The test covers one 8B model in BF16 with fixed context and output lengths. It does not establish results for quantized models, other model sizes, training, fine-tuning, longer contexts, different batching or concurrency, or multi-GPU scaling.
What this means for you
For this Llama 3.1 8B BF16 serving setup, the RTX 5090 recorded much lower TTFT than the A100 and similar high-load throughput. The RTX 4090 was slower in both recorded scenarios. Hardware selection still depends on memory capacity, reliability features, software support, concurrency, and the workload you actually plan to run.
For broader RTX 4090 workload fit, see the RTX 4090 AI guide. For current Hivenet availability and price context, use the current RTX 4090 retirement and RTX 5090 pricing article and confirm the active preset in the Compute console.
Your next workload belongs on Hivenet.
Pick one AI, compute, or storage workload and see the difference for yourself. Spin it up in minutes, or let our team map your fastest path to production.